| Millions of 2013 pesos | 2013 1 | 2013 | 2012 | % Change | 2011 2 | % Change |
|---|---|---|---|---|---|---|
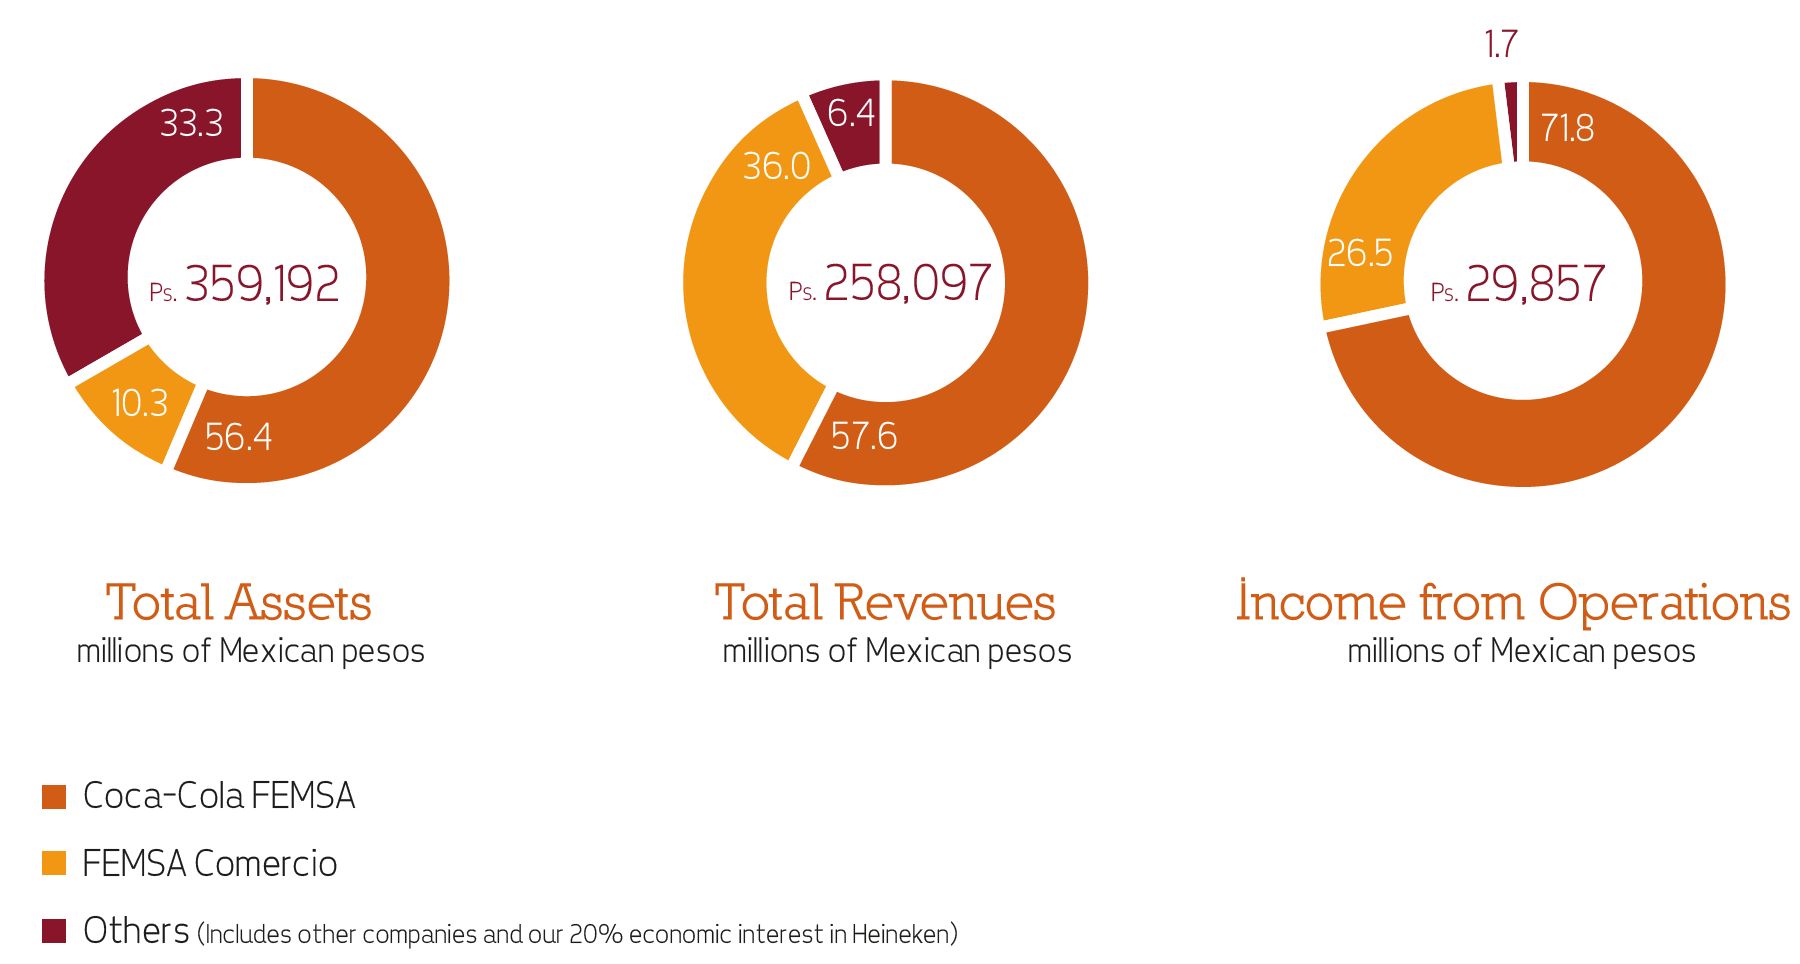
| Total Revenues | 19,705 | 258,097 | 238,309 | 8.3% | 201,540 | 18.2% |
| Income from Operations 3 | 2,280 | 29,857 | 29,227 | 2.2% | 24,484 | 19.4% |
| Consolidated Net Income | 1,692 | 22,155 | 28,051 | 21.0% | 20,901 | 34.2% |
| Controlling Interest 4 | 1,216 | 15,922 | 20,707 | -23.1% | 15,332 | 35.1% |
| Non-Controlling Interest | 476 | 6,233 | 7,344 | -15.1% | 5,569 | 31.9% |
| Total Assets | 27,423 | 359,192 | 295,942 | 21.4% | 263,362 | 12.4% |
| Total Liabilities | 10,432 | 136,642 | 85,781 | 59.3% | 71,191 | 20.5% |
| Total Equity | 16,991 | 222,550 | 210,161 | 5.9% | 192,171 | 9.4% |
| Capital Expenditures | 1,365 | 17,882 | 15,560 | 14.9% | 12,609 | 23.4% |
| Controlling Interest Book Value per Share 5 | 0.68 | 8.91 | 8.68 | 2.6% | 8.06 | 7.7% |
| Net Controlling Interest Income per Share 5 | 0.07 | 0.89 | 1.16 | -23.3% | 0.86 | 34.9% |
| Headcount 6 | 209,232 | 182,260 | 14.8% | 168,370 | 8.2% |
1 U.S. dollar figures are converted from Mexican pesos using the noon-buying rate published by the U.S. Federal Reserve Board,
which was Ps. 13.0980 per US$1.00 as of December 31, 2013.
2 2011 figures were restated for comparison with 2013 and 2012 as a result of transition to International Financial Reporting Standards (IFRS).
3 Company’s key performance indicator.
4 Represents the net income that is assigned to the controling shareholders of the entity.
5 Data based on outstanding shares of 17,891,131,350.
6 Includes headcount from Coca-Cola FEMSA, FEMSA Comercio and other businesses of FEMSA.