FEMSA’s mission is to create economic and social value through business enterprises and institutions. This includes consistently attracting and meeting consumer demand, generating financial returns for our shareholders and promoting higher social growth.
Our 2017 financial results reflect the economic value we continue to create in the countries where FEMSA operates.
| Millions of pesos | 2017(1) | 2017 | 2016 | %Change | 2015 | %Change |
|---|---|---|---|---|---|---|
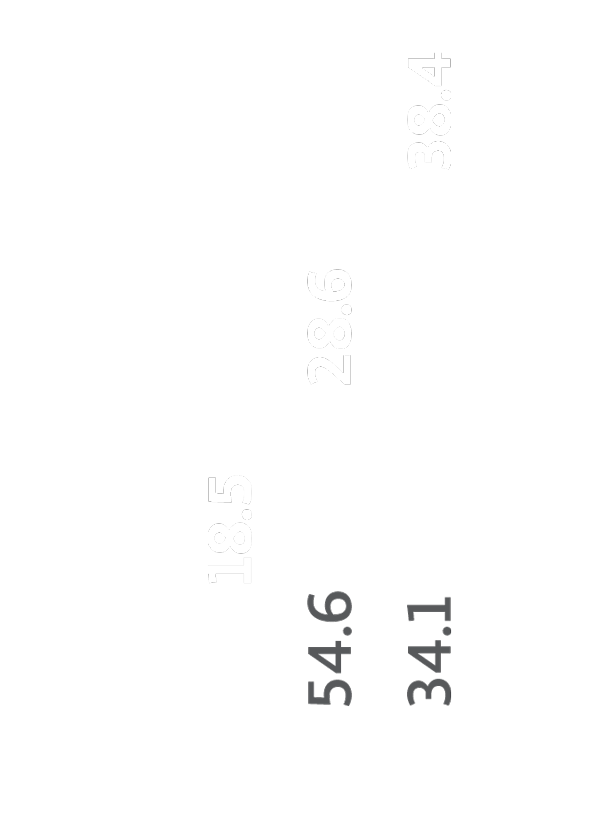
| Total revenues | 23,445 | 460,456 | 399,507 | 15.3% | 311,589 | 28.2% |
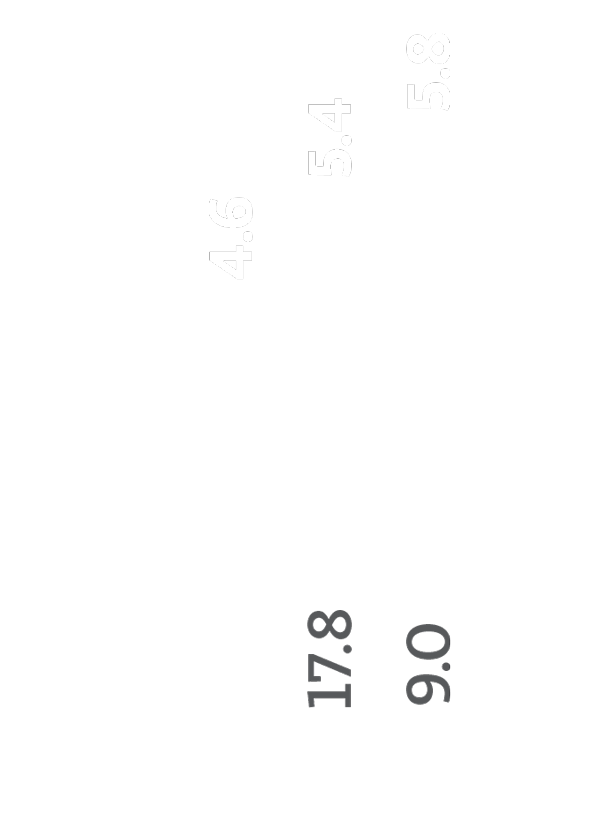
| Income from operations (2) | 2,110 | 41,439 | 37,427 | 10.7% | 33,735 | 10.9% |
| Operating margin | 9.0% | 9.4% | 10.8% | |||
| Consolidated net income | 1,895 | 37,206 | 27,175 | 36.9% | 23,276 | 16.8% |
| Controlling interest net income (3) | 2,160 | 42,408 | 21,140 | 100.6% | 17,683 | 19.5% |
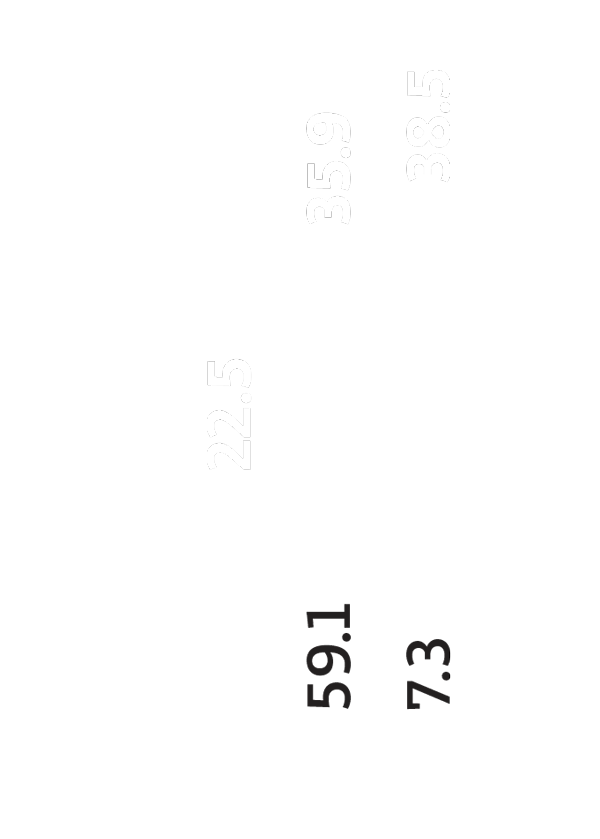
| Controlling interest earnings per BD unit (4) | 0.6 | 11.9 | 5.9 | 101.7% | 4.9 | 20.4% |
| Controlling interest earnings per ADS (5) | 6.0 | 118.5 | 59.1 | 100.5% | 49.4 | 19.6% |
| EBITDA | 3,127 | 61,418 | 54,987 | 11.7% | 46,626 | 17.9% |
| EBITDA margin | 13.3% | 13.8% | 15.0% | |||
| Total assets | 29,967 | 588,541 | 545,623 | 7.9% | 409,332 | 33.3% |
| Total liabilities | 12,812 | 251,629 | 259,453 | -3.0% | 167,476 | 54.9% |
| Total equity | 17,155 | 336,912 | 286,170 | 17.7% | 241,856 | 18.3% |
| Capital expenditures | 1,282 | 25,180 | 22,155 | 13.7% | 18,885 | 17.3% |
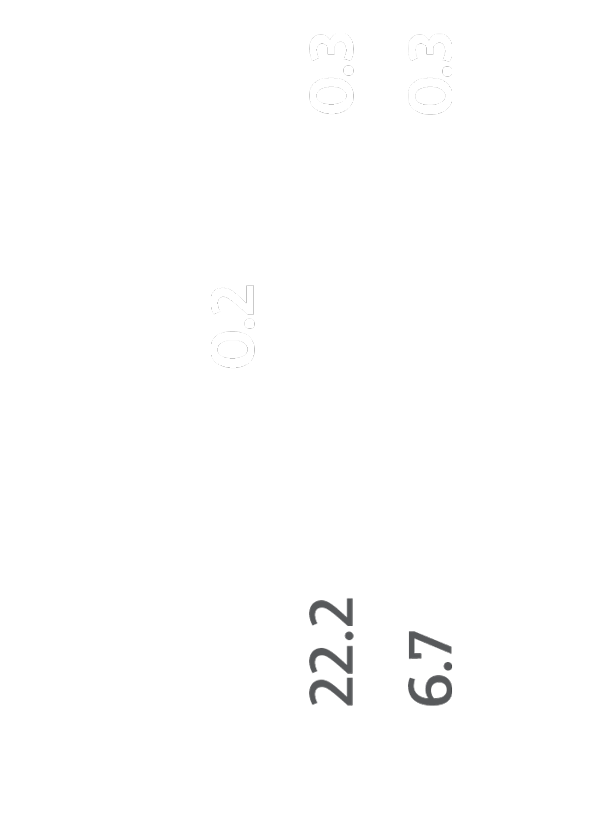
| Total cash and cash equivalents (6) | 4,936 | 96,944 | 43,637 | 122.2% | 29,396 | 48.4% |
| Short-term debt | 692 | 13,590 | 7,281 | 86.7% | 5,895 | 23.5% |
| Long-term debt | 5,996 | 117,758 | 131,967 | -10.8% | 85,969 | 53.5% |
| Headcount (7) | 295,027 | 266,144 | 10.9% | 246,158 | 8.1% |
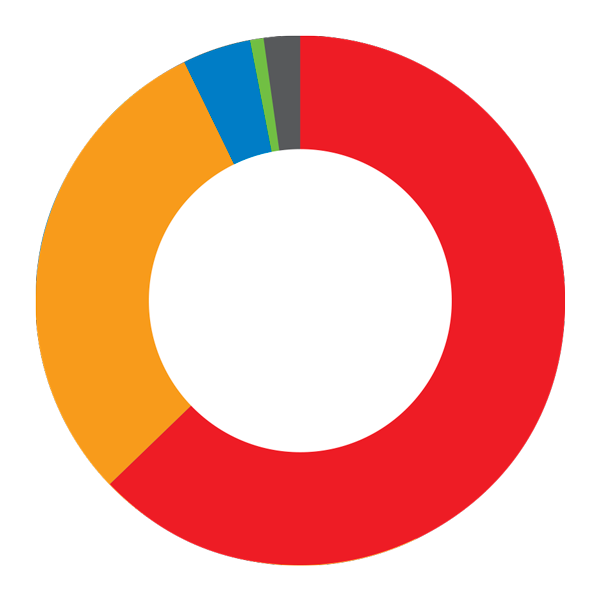
Total Revenues
by Business Unit
millions of Mexican pesos


| Coca-Cola FEMSA | 43% | |
|---|---|---|
| FEMSA Comercio: | ||
| Retail Division | 32% | |
| Health Division | 10% | |
| Fuel Division | 8% | |
| Others* | 7% |
Total Assets
by Business Unit
millions of Mexican pesos


| Coca-Cola FEMSA | 46% | |
|---|---|---|
| FEMSA Comercio: | ||
| Retail Division | 11% | |
| Health Division | 6% | |
| Fuel Division | 1% | |
| Others* | 36% |
Income from Operations
by Business Unit 1
millions of Mexican pesos

| Coca-Cola FEMSA | 63% | |
|---|---|---|
| FEMSA Comercio: | ||
| Retail Division | 30% | |
| Health Division | 4% | |
| Fuel Division | 1% | |
| Others* | 2% |
EBITDA 2
by Business Unit
millions of Mexican pesos


| Coca-Cola FEMSA | 64% | |
|---|---|---|
| FEMSA Comercio: | ||
| Retail Division | 28% | |
| Health Division | 4% | |
| Fuel Division | 1% | |
| Others* | 3% |


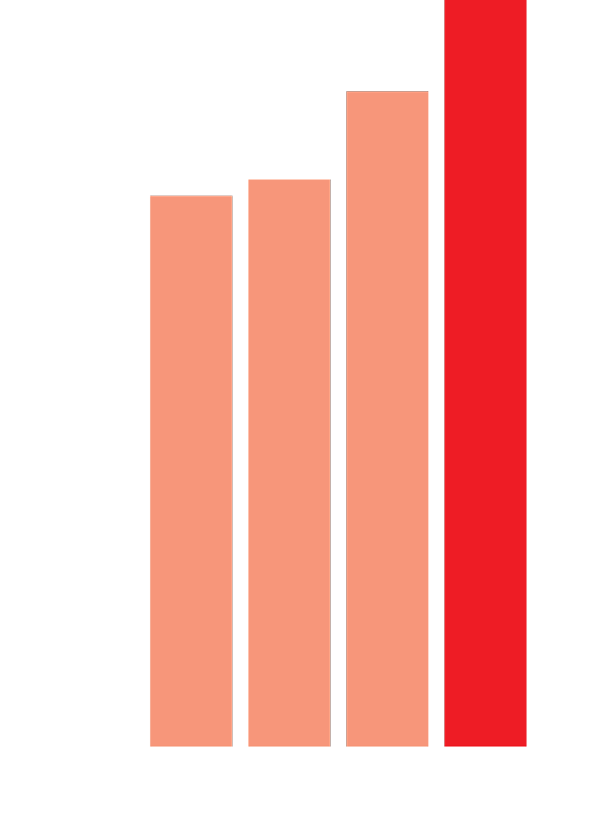
Headcount
thousands


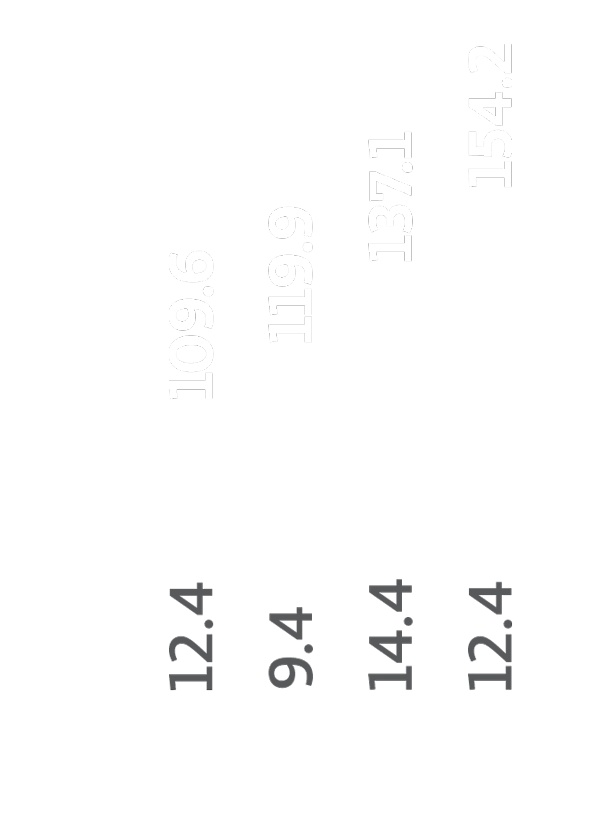
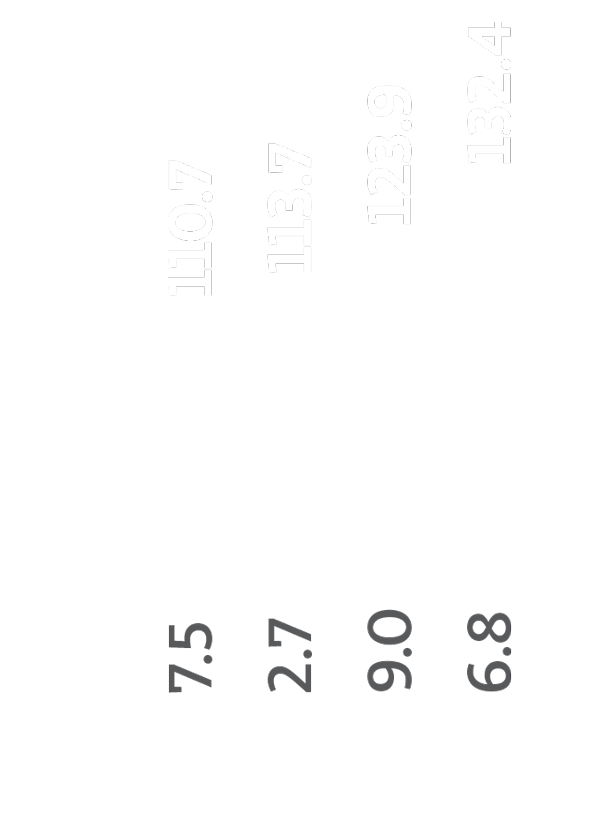
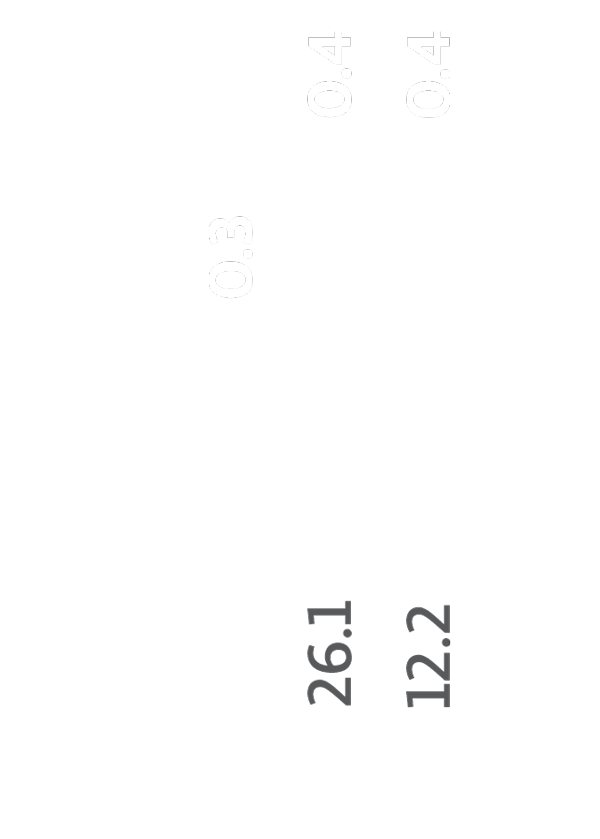
Total Revenues
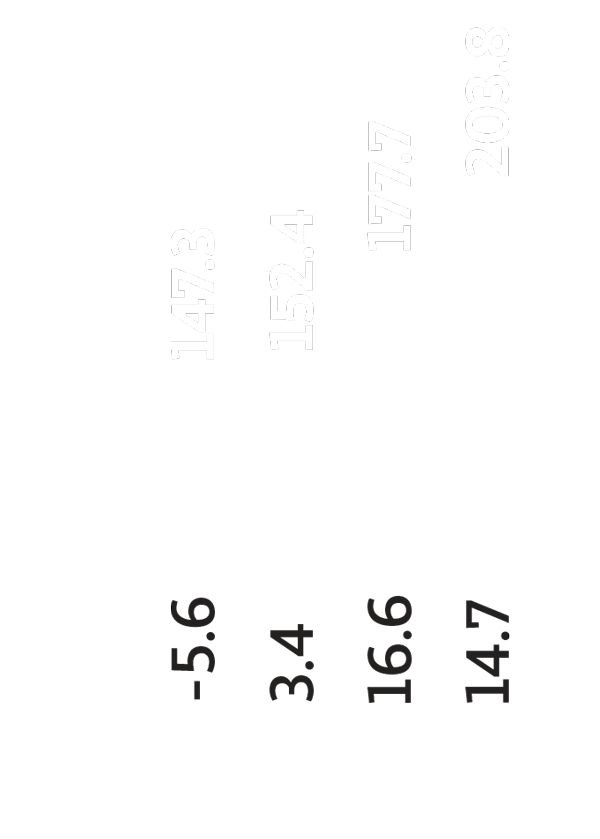
billions of Mexican pesos


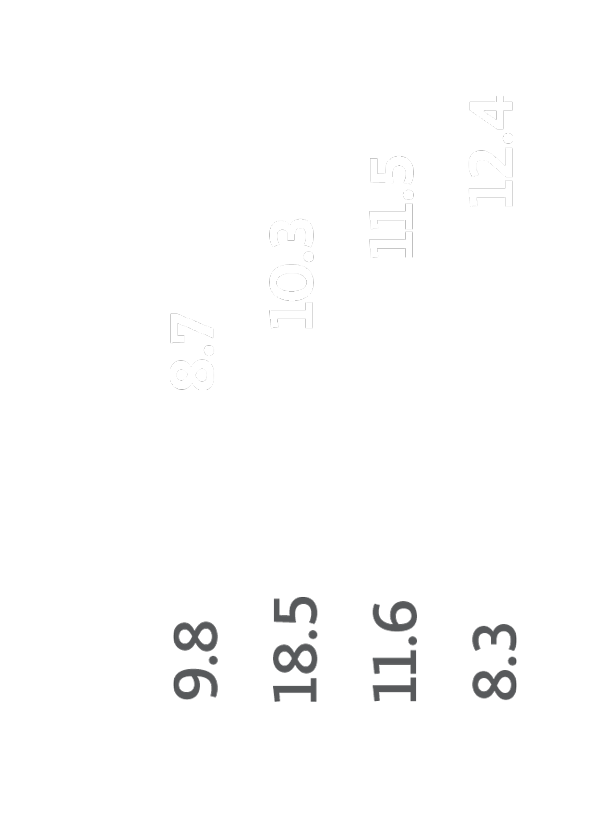
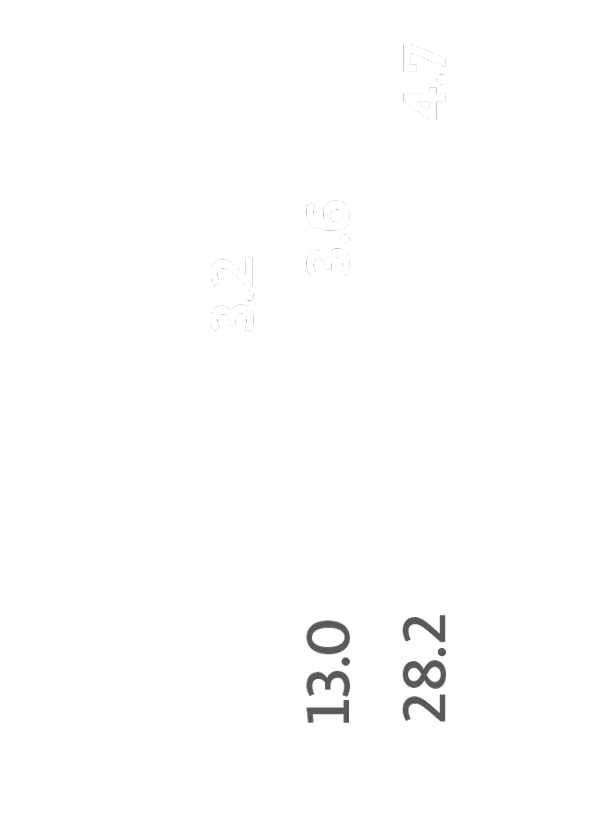
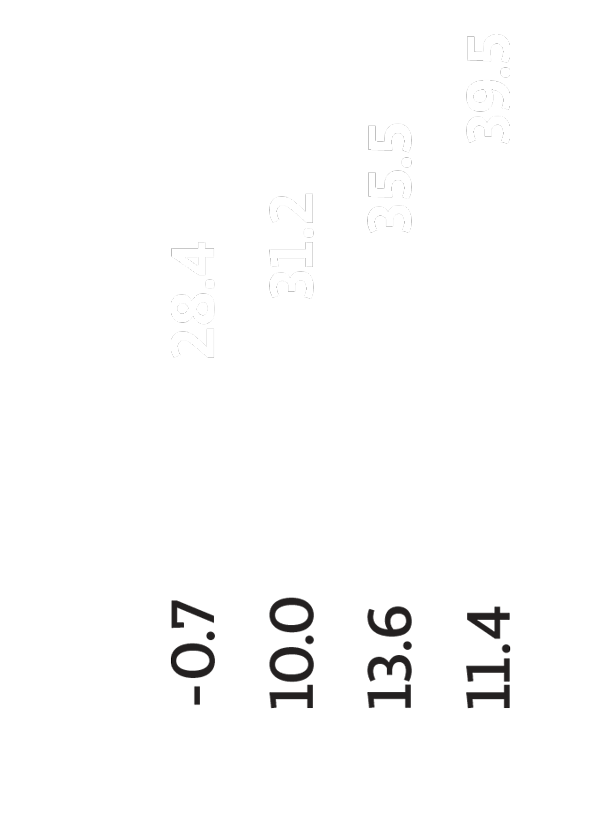
Income from Operations1
billions of Mexican pesos


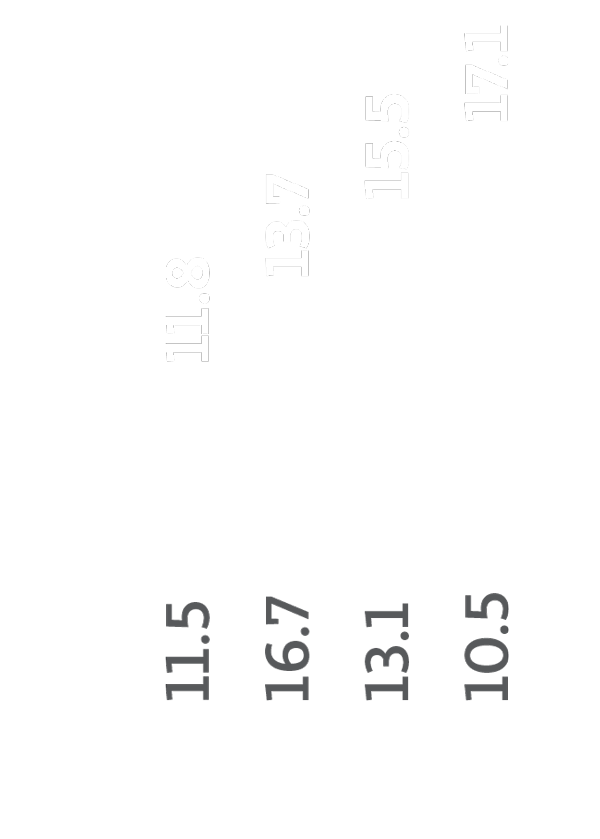
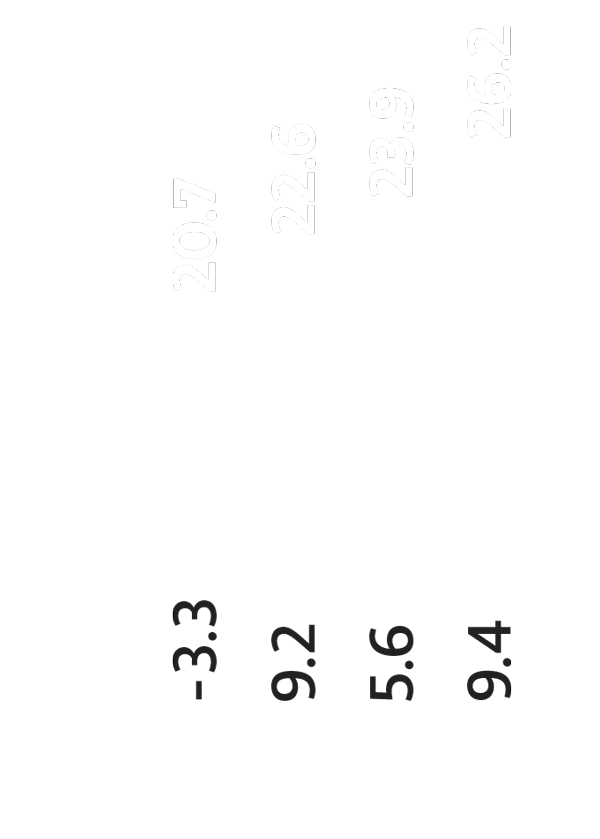
EBITDA2
billions of Mexican pesos


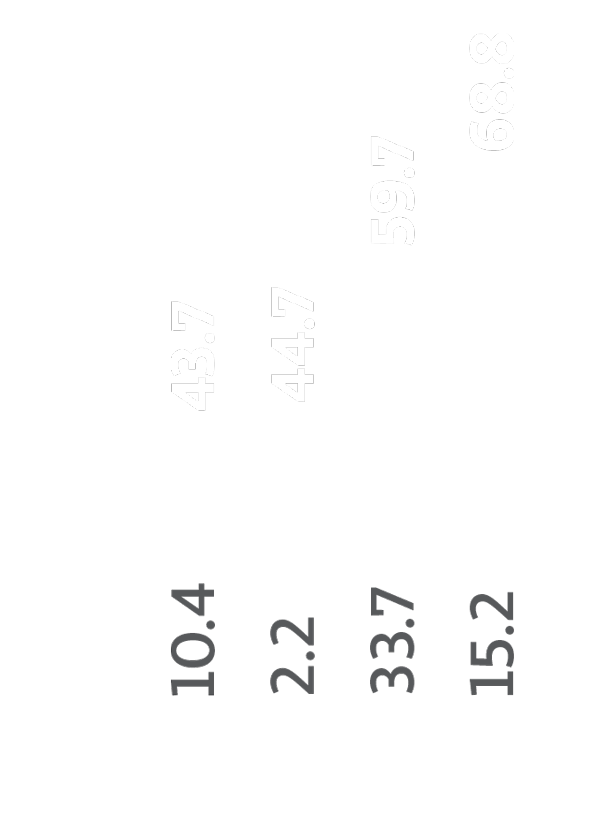
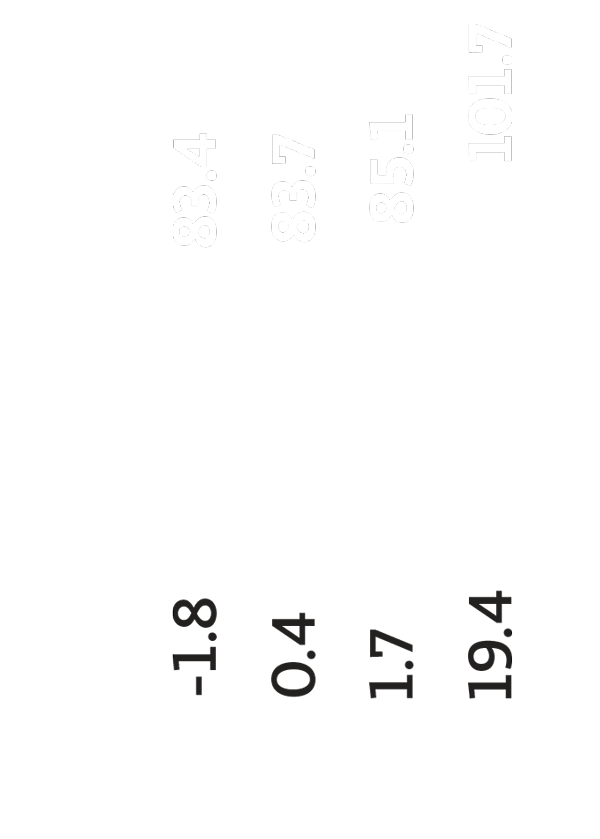
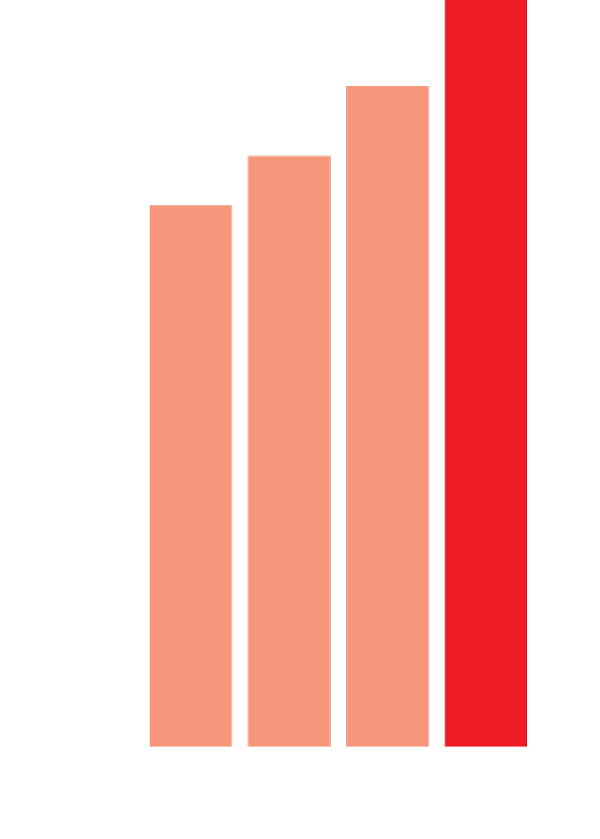
Total Assets
billions of Mexican pesos


Headcount
thousands


Total Revenues
billions of Mexican pesos


Income from Operations1
billions of Mexican pesos


EBITDA2
billions of Mexican pesos


Total Assets
billions of Mexican pesos


Headcount
thousands


Total Revenues
billions of Mexican pesos


Income from Operations1
billions of Mexican pesos


EBITDA2
billions of Mexican pesos


Total Assets
billions of Mexican pesos


Headcount*
thousands
Total Revenues
billions of Mexican pesos


Income from Operations1
billions of Mexican pesos

EBITDA2
billions of Mexican pesos


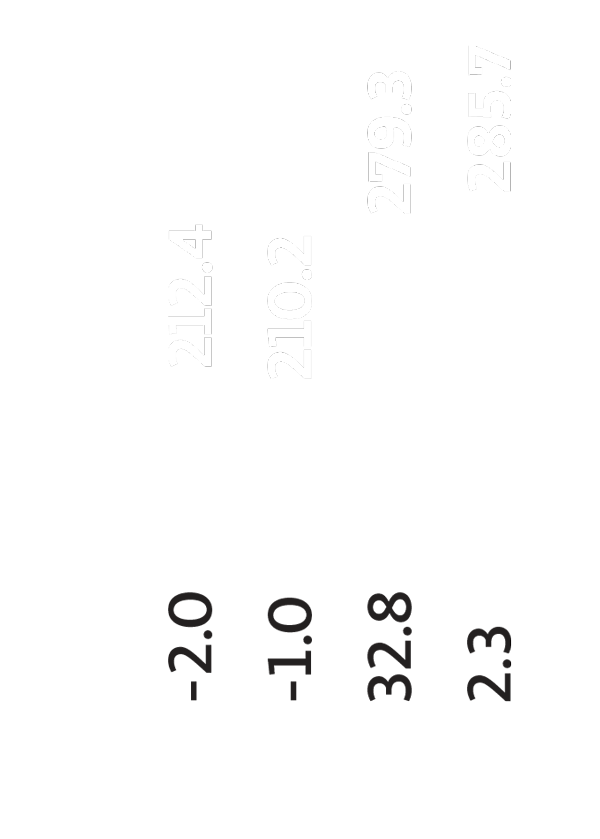
Total Assets
billions of Mexican pesos
We create value for our stakeholders not only through successful economic performance, but also by generating the social, environmental and economic conditions necessary to operate today and to grow sustainably over time. In 2017, we continued to more fully integrate sustainability into our business strategy.
| 2017 | 2016 | 2015 | ||
|---|---|---|---|---|
 |
Average hours of training per employee | 33.92 | 25.60 | 26.60 |
| Accident Index 1 | 2.10 | 2.13 | 3.94 | |
| Organizational Climate Result 2 | 80.80 | 81.50 | 81.40 | |
 |
Energy Intensity (Gigajoules / Total Revenues in Ps. million) |
41.26 | 40.46 | 53.01 |
| Greenhouse gas emissions intensity (Tons of equivalent CO2 / Total Revenues in Ps. million) |
3.36 | 3.59 | 5.33 | |
| Water efficiency (liters of water used per liter of beverage produced) |
1.65 | 1.72 | 1.79 | |
 |
Economic spill to the community 3 |
Ps. 253.2 billion US$ 12.8 billion |
Ps. 258.2 billion US$ 12.5 billion |
Ps. 184.4 billion US$ 10.7 billion |
| Percentage of procurement budget on local suppliers 4 | 87% | 82% | 85% | |
| Direct beneficiaries of FEMSA Foundation programs 5 | 1,248,123 | 1,124,319 | 631,250 | |
|
||||
Our integrated Annual Report 2017, reflects our solid corporate governance and transparency.