Financial
| Millions of pesos | 2016 (1) | 2016 | 2015 | %Change | 2014 | %Change |
|---|---|---|---|---|---|---|
| Total revenues | 19,377 | 399,507 | 311,589 | 28.2% | 263,449 | 18.3% |
| Income from operations (2) | 1,815 | 37,427 | 33,735 | 10.9% | 29,983 | 12.5% |
| Operating margin | 9.4% | 10.8% | 11.4% | |||
| Consolidated net income | 1,318 | 27,175 | 23,276 | 16.8% | 22,630 | 2.9% |
| Controlling interest net income (3) | 1,025 | 21,140 | 17,683 | 19.5% | 16,701 | 5.9% |
| Controlling interest earnings per BD unit (4) | 0.3 | 5.9 | 4.9 | 20.4% | 4.7 | 4.3% |
| Controlling interest earnings per ADS (5) | 2.9 | 59.1 | 49.4 | 19.6% | 46.7 | 5.8% |
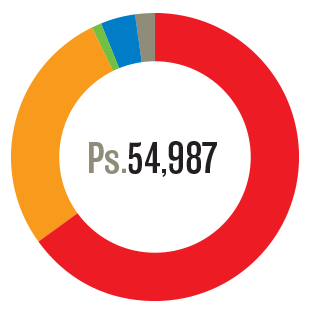
| EBITDA | 2,667 | 54,987 | 46,626 | 17.9% | 40,945 | 13.9% |
| EBITDA margin | 13.8% | 15.0% | 15.5% | |||
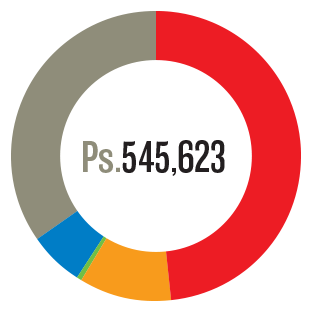
| Total assets | 26,465 | 545,623 | 409,332 | 33.3% | 376,173 | 8.8% |
| Total liabilities | 12,584 | 259,453 | 167,476 | 54.9% | 146,051 | 14.7% |
| Total equity | 13,880 | 286,170 | 241,856 | 18.3% | 230,122 | 5.1% |
| Capital expenditures | 1,075 | 22,155 | 18,885 | 17.3% | 18,163 | 4.0% |
| Total cash and cash equivalents (6) | 2,117 | 43,637 | 29,396 | 48.4% | 35,497 | -17.2% |
| Short-term debt | 353 | 7,281 | 5,895 | 23.5% | 1,553 | 279.6% |
| Long-term debt | 6,401 | 131,967 | 85,969 | 53.5% | 82,935 | 3.7% |
| Headcount (7) | 266,144 | 246,158 | 8.1% | 216,740 | 13.6% |
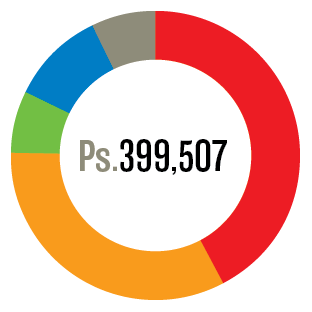
| Coca-Cola FEMSA | 43% | |
|---|---|---|
| FEMSA Comercio: | ||
| Retail Division | 33% | |
| Fuel Division | 7% | |
| Health Division | 10% | |
| Others8 | 7% |
| Coca-Cola FEMSA | 48% | |
|---|---|---|
| FEMSA Comercio: | ||
| Retail Division | 10% | |
| Fuel Division | 1% | |
| Health Division | 6% | |
| Others8 | 35% |
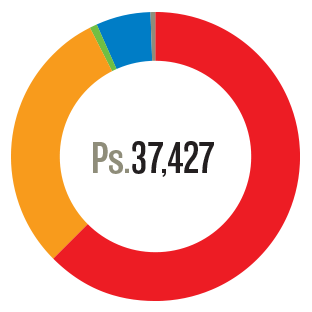
| Coca-Cola FEMSA | 64% | |
|---|---|---|
| FEMSA Comercio: | ||
| Retail Division | 31% | |
| Fuel Division | 0.5% | |
| Health Division | 4% | |
| Others8 | 0.5% |
| Coca-Cola FEMSA | 65% | |
|---|---|---|
| FEMSA Comercio: | ||
| Retail Division | 28% | |
| Fuel Division | 1% | |
| Health Division | 4% | |
| Others8 | 2% |
![]() Retail Division
Retail Division ![]() Health Division
Health Division ![]() Fuel Division
Fuel Division
Headcount
thousands


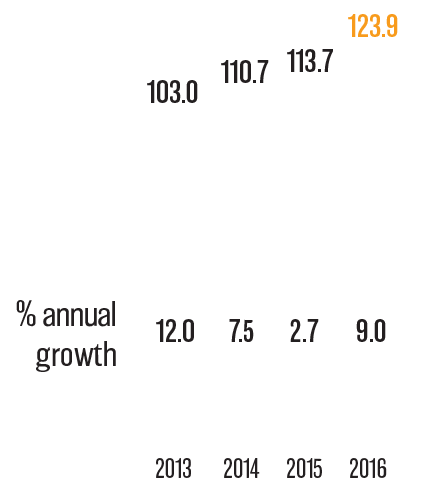
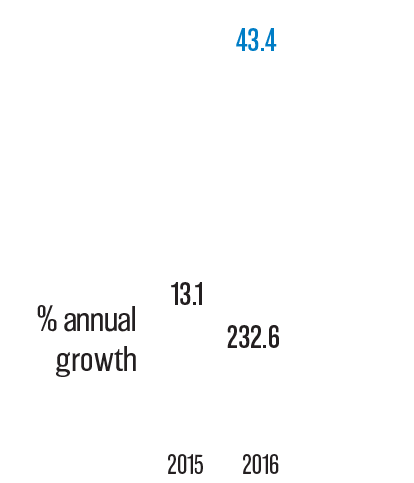
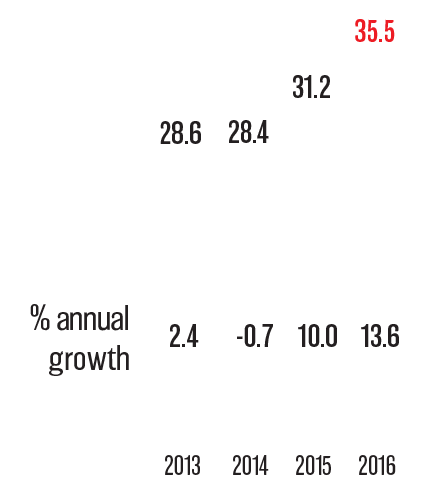
Total Revenues
billions of Mexican pesos


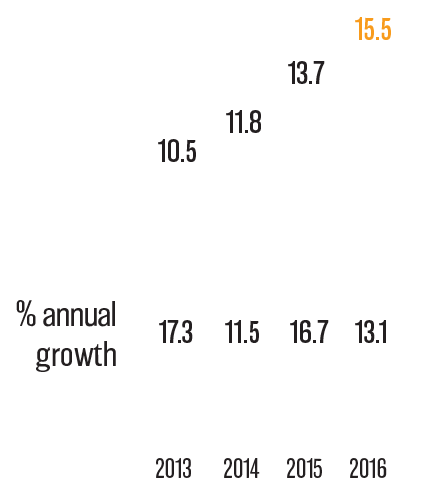
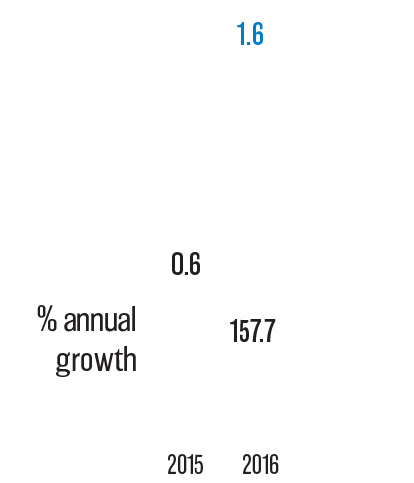
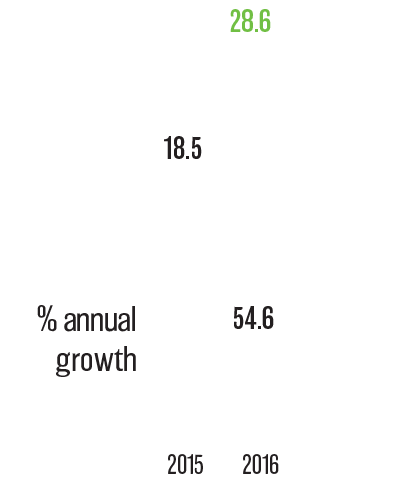
Income from Operations1
billions of Mexican pesos


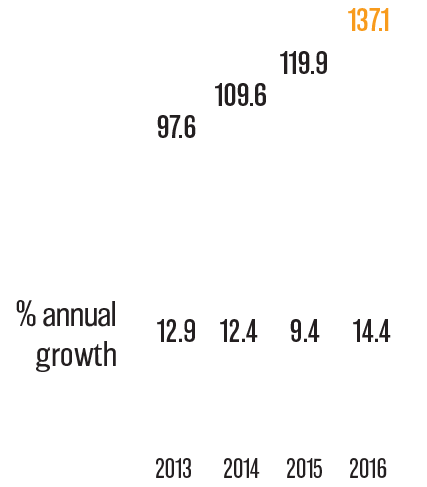
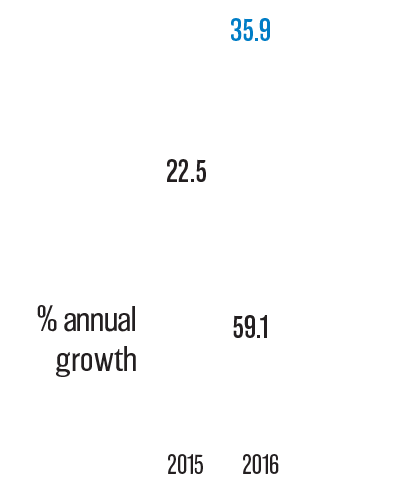
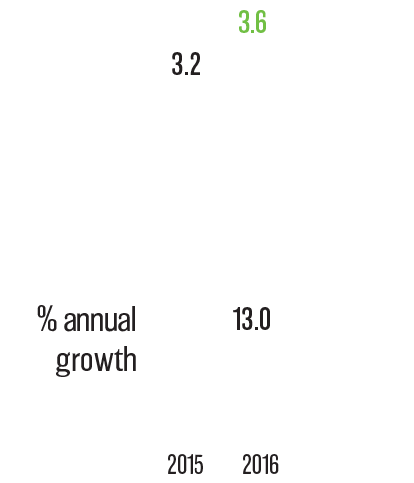
EBITDA2
billions of Mexican pesos


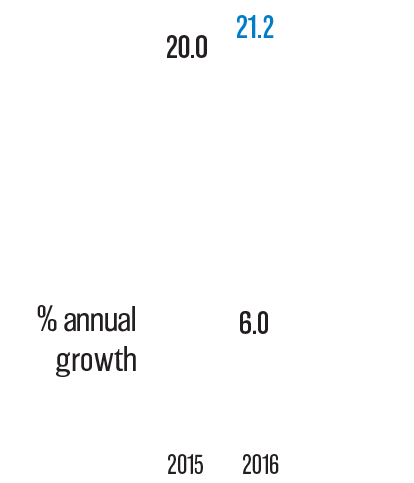
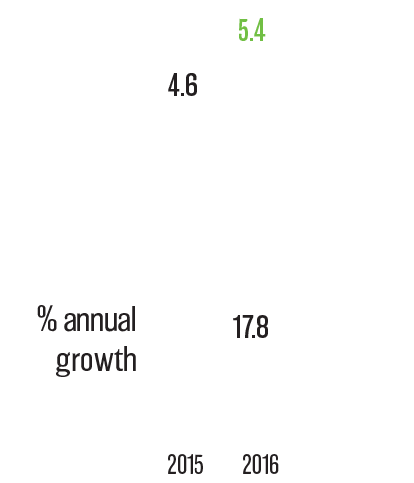
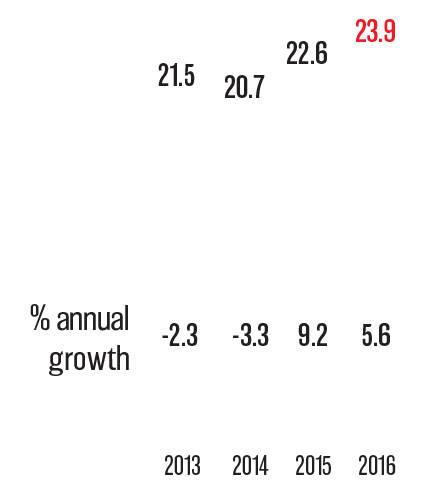
Total Assets
billions of Mexican pesos


Headcount
thousands


Total Revenues
billions of Mexican pesos


Income from Operations1
billions of Mexican pesos


EBITDA2
billions of Mexican pesos


Total Assets
billions of Mexican pesos


Headcount
thousands


Total Revenues
billions of Mexican pesos


Income from Operations1
billions of Mexican pesos


EBITDA2
billions of Mexican pesos


Total Assets
billions of Mexican pesos


Headcount3
thousands


Total Revenues
billions of Mexican pesos


Income from Operations1
billions of Mexican pesos


EBITDA2
billions of Mexican pesos


Total Assets
billions of Mexican pesos