ANNUAL REPORT
2019
| Millions of pesos | 2019 1 | 2019 2 | 2018 8 | %Change | 2017 9 | %Change |
|---|---|---|---|---|---|---|
| Total revenues | 26,867 | 506,711 | 469,744 | 7.9% | 439,932 | 6.8% |
| Income from operations 3 | 2,500 | 47,152 | 41,576 | 13.4% | 40,261 | 3.3% |
| Operating margin | 9.3% | 8.9% | 9.2% | |||
| Consolidated net income | 1,487 | 28,048 | 33,079 | -15.2% | 37,206 | -11.1% |
| Controlling interest net income 4 | 1,098 | 20,699 | 23,990 | -13.7% | 42,408 | -43.4% |
| Controlling interest earnings per BD unit 5 | 0.3 | 5.8 | 6.7 | -13.4% | 11.9 | -43.7% |
| Controlling interest earnings per ADS 6 | 3.1 | 57.8 | 67.0 | -13.7% | 118.5 | -43.5% |
| EBITDA | 4,000 | 75,440 | 60,458 | 24.8% | 58,165 | 3.9% |
| EBITDA margin | 14.9% | 12.9% | 13.2% | |||
| Total assets | 33,804 | 637,541 | 576,381 | 10.6% | 588,541 | -2.1% |
| Total liabilities | 16,532 | 311,790 | 240,839 | 29.5% | 251,629 | -4.3% |
| Total equity | 17,272 | 325,751 | 335,542 | -2.9% | 336,912 | -0.4% |
| Capital expenditures | 1,356 | 25,579 | 24,266 | 5.4% | 23,486 | 3.3% |
| Total cash and cash equivalents 7 | 3,476 | 65,562 | 62,047 | 5.7% | 96,944 | -36.0% |
| Short-term debt | 859 | 16,204 | 13,674 | 18.5% | 13,590 | 0.6% |
| Long-term debt | 5,395 | 101,747 | 114,990 | -11.5% | 117,758 | -2.4% |
| Headcount 8 | 314,656 | 297,073 | 5.9% | 295,027 | 0.7% |
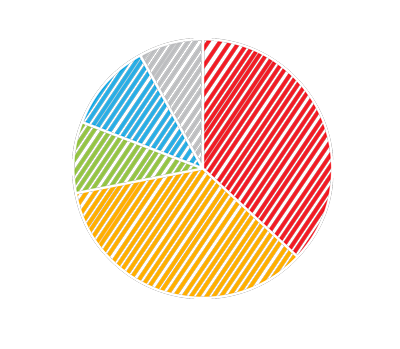
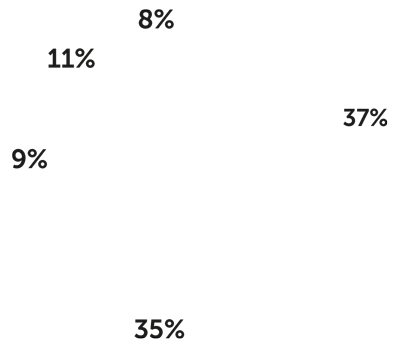
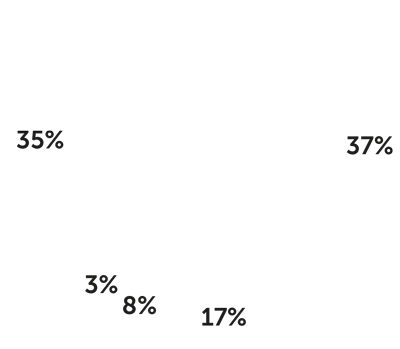
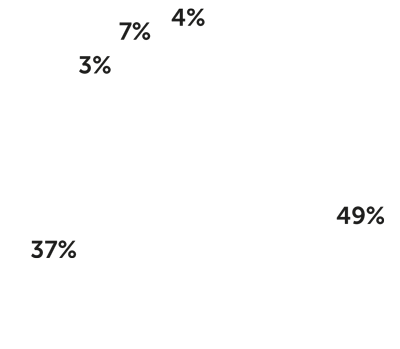
Total Revenues
by Business Unit
millions of Mexican pesos
Ps. 506,711
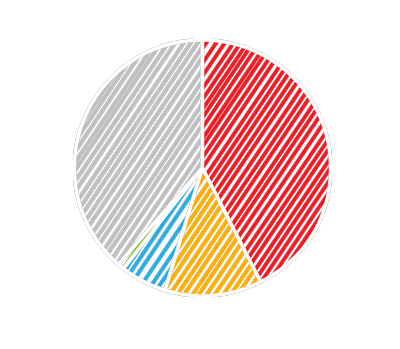
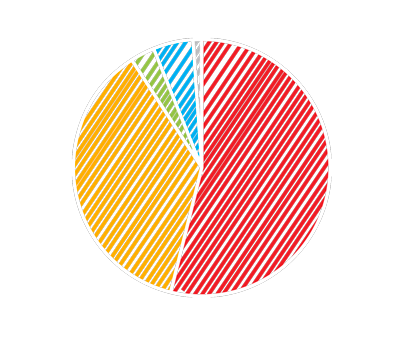
Total Assets
by Business Unit
millions of Mexican pesos
Ps. 637,541
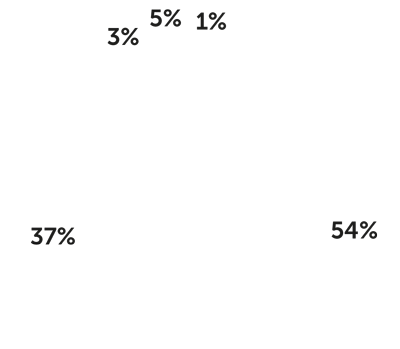
Income from Operations 1
by Business Unit
millions of Mexican pesos
Ps. 47,152
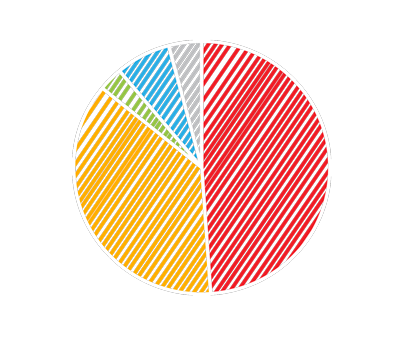
EBITDA 2
by Business Unit
millions of Mexican pesos
Ps. 75,440
Coca-Cola FEMSA
FEMSA Comercio: Proximity Division Health Division Fuel Division Others*
* Includes FEMSA Strategic Businesses.
1. Company’s key performance indicator.
2. EBITDA equals to Income from operations plus depreciation, amortization and other non-cash items
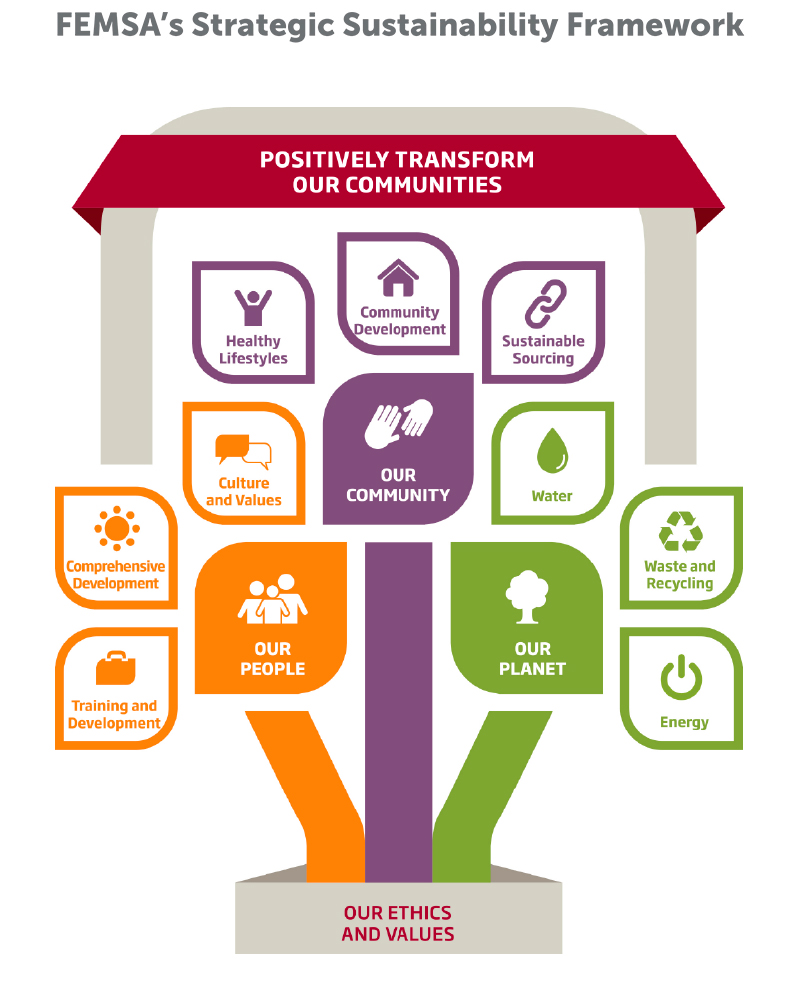
FEMSA contributes to the development of the communities and regions where we have a presence by fulfilling our mission: to generate economic and social value through companies and institutions.
Our business model focuses not only on maximizing financial value for our shareholders, but also operating in a sustainable way that makes a positive contribution to society and the environment. In fact, sustainable development continues to be a key element in our business model.
Our business units adhere to ethical business practices aligned with our organizational values. This includes implementing inclusive labor practices, optimizing the use of natural resources, strengthening local supply chains, supporting and developing suppliers, positively transforming communities, and connecting effectively with customers.
In this 2019 integrated Annual Report, we share the ways in which our business simultaneously generates economic and social value, including examples of how sustainability is integrated into our daily operations.
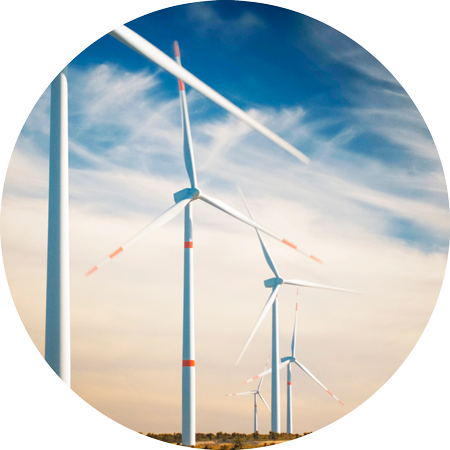
In 2019, FEMSA made significant progress toward achieving our corporate goal to source 85% of the total electric energy demand of our operations in Mexico from renewable energy by 2020.
Making our Clean Energy Goal a Reality
By expanding FEMSA’s use of renewable energy, we are contributing to the climate change solution by replacing carbon-intensive energy sources and significantly reducing greenhouse gas (GHG) emissions. With this strategy, we are contributing to the conservation of natural resources and supporting the development of stronger communities.
FEMSA Comercio
13,437
OXXO stores
13
OXXO
distribution centers
622
pharmacies
Coca-Cola FEMSA
20
manufacturing plants
58
distribution centers
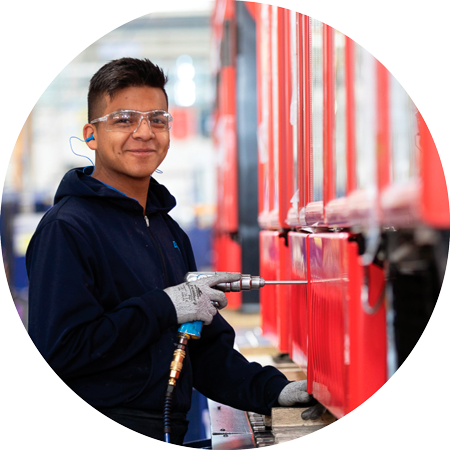
FEMSA Strategic Businesses
2
IMBERA plants
1
PTM plant
The use of these renewable energy sources contributes to the avoidance of 623,808 tons of CO2 emissions per year, which is equivalent to:
Planting
15,969,481 trees
Powering
651,434
households in Mexico
avoid consuming
1,434,758
barrels of oil
Shaping the Circular Economy
At FEMSA, we are working to find solutions designed to promote sustainable consumption and production practices, that is, doing more with less resources. We are adopting and promoting the principles of the Circular Economy in FEMSA’s business units by redesigning, reducing, reusing, repairing and recycling.
In 2019, we continued to work toward our corporate goal of achieving Zero Waste to Landfill (ZWL) status for all FEMSA operations and facility processes by 2030. This goal does not include post-consumer waste associated with FEMSA products and services. A few examples of our efforts to support the Circular Economy:
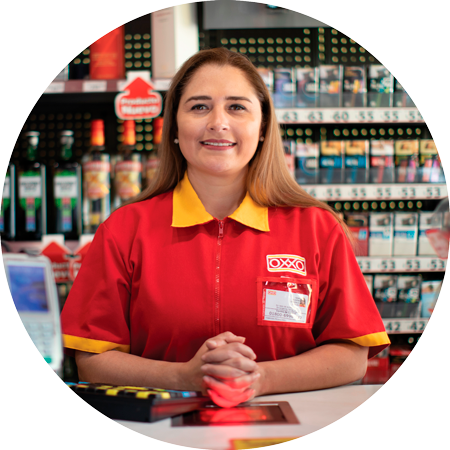
OXXO
Store employee uniforms are manufactured with 50% recycled PET fiber. At the end of their useful life, the uniforms are recycled and used as raw material for other products.
AlPunto
A new recycling facility has the capacity to recover up to 60,000 end-of-life refrigerators per year and either repair and reuse them, or recycle up to 90% of refrigerator components.
Coca-Cola FEMSA
We are redesigning PET bottles to make them lighter, 100% recyclable, and made with higher percentages of recycled material. We are also setting the standard and global benchmark for our high rates of PET collection in Mexico.
* This goal does not include post-consumer waste associated with FEMSA products and services that are disposed of outside the boundaries of FEMSA’s control and facilities.
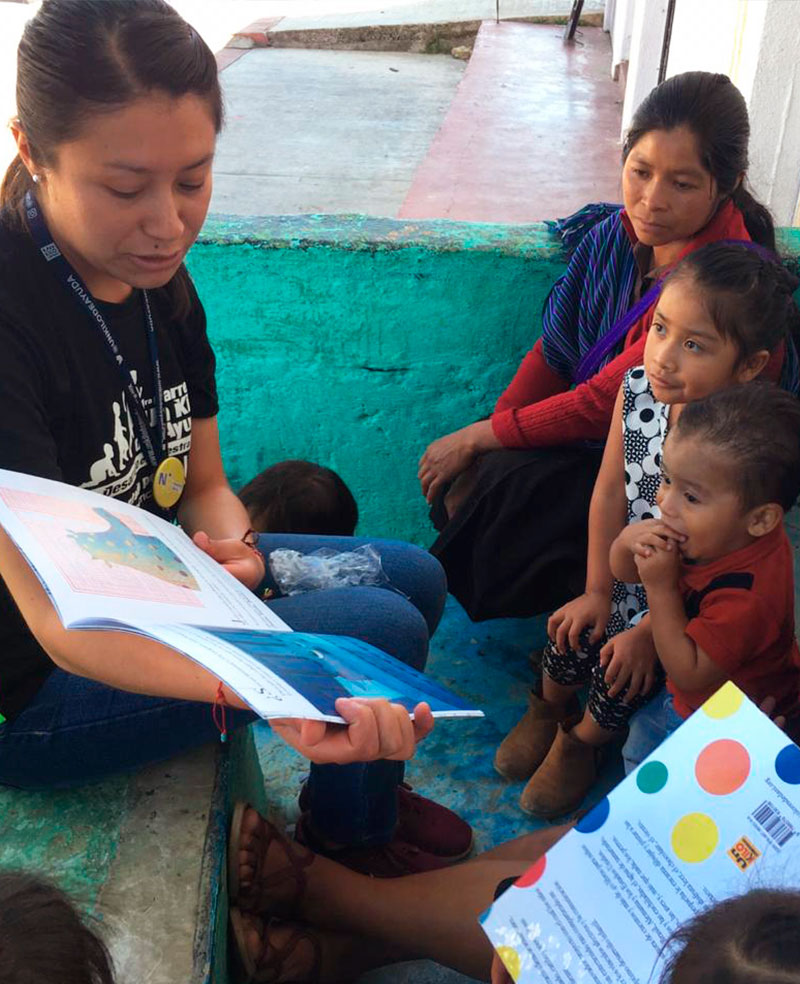
Our Social Contributions
At FEMSA, we contribute to the positive transformation of the communities in the regions where we live and work. Through dialogue and collaboration, we aim to maximize the impact of the people, community partners, and organizations with whom we work. This includes supporting programs and engagement opportunities related to education, entrepreneurship, science and technology, social leadership, culture, and citizen participation. In this way, we multiply the benefits and positive impacts we can make in the community. For example:
OXXO Customer Ticket Round-Up (Programa Redondeo Clientes OXXO): Our store cashiers invite OXXO and YZA customers to donate the cents needed to “round-up” the total value of their purchase to the next integer amount. The collected amounts are donated to local charitable institutions on behalf of customers.
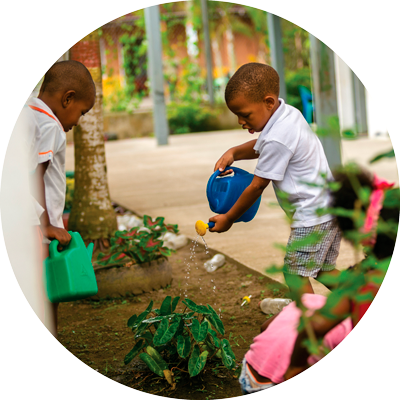
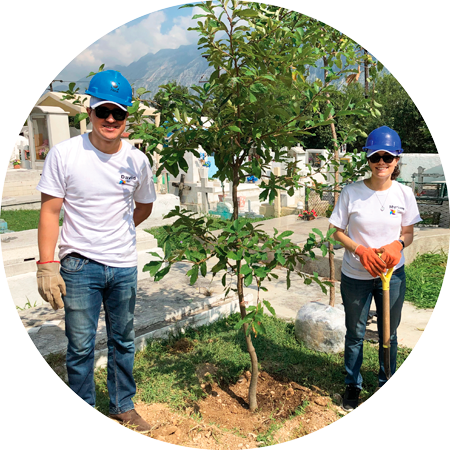
Corporate Volunteering: FEMSA offers time off for employees to participate in community projects during business hours. FEMSA also promotes and enables volunteer opportunities for employees, their family, and friends to contribute their time and talents on weekends.
With the integration of FEMSA’s sustainability strategy as part of our business model, we contribute to the United Nations Sustainable Development Goals, an ambitious plan to achieve a more inclusive, prosperous, sustainable, and resilient world. Joining the efforts of the 2030 Global Agenda means that we are working to make a positive impact towards the improvement of the quality of life and well-being of people, as well as to the sustainable use of natural resources.
Sustainable Development Key Performance Indicators
| 2019 | 2018 | 2017 | ||
|---|---|---|---|---|
 |
Total hours of training | 8,657,577 | 8,957,257 | 10,006,244 |
| Accident index 1 | 2.48 | 2.50 | 2.10 | |
| Professional diseases rate 1 | 0.069 | 0.017 | 0.03 | |
| Organizational climate result 2 | 81.00 | 81.00 | 80.80 | |
 |
Energy intensity (Gigajoules / Total Revenues in Ps. million) |
34.40 | 39.95 | 37.27 |
| Greenhouse gas emissions intensity (Tons of equivalent CO2 / Total Revenues in Ps. million) |
1.77 | 3.38 | 3.27 | |
| Water efficiency (liters of water used per liter of beverage produced) |
1.52 | 1.59 | 1.65 | |
 |
Corporate volunteering hours | 461,020 | 593,300 | 367,796 |
| Percentage of procurement budget on local suppliers 3 | 87% | 82% | 87% | |
| Direct beneficiaries of FEMSA Foundation programs 4 | 1,657,786 | 1,423,985 | 1,248,123 |