| Millions of pesos | 2018 (1) | 2018 | 2017 (8) | %Change | 2016 | %Change |
|---|---|---|---|---|---|---|
| Total revenues | 23,924 | 469,744 | 439,932 | 6.8% | 399,507 | 10.1% |
| Income from operations 2 | 2,117 | 41,576 | 40,261 | 3.3% | 37,427 | 7.6% |
| Operating margin | 8.9% | 9.2% | 9.4% | |||
| Consolidated net income | 1,684 | 33,079 | 37,206 | -11.1% | 27,175 | 23.2% |
| Controlling interest net income 3 | 1,221 | 23,990 | 42,408 | -43.4% | 21,140 | 100.6% |
| Controlling interest earnings per BD unit 4 | 0.3 | 6.7 | 11.9 | -43.7% | 5.9 | 101.7% |
| Controlling interest earnings per ADS 5 | 3.4 | 67.0 | 118.5 | -43.5% | 59.1 | 100.5% |
| EBITDA | 3,079 | 60,458 | 58,165 | 3.9% | 54,987 | 5.8% |
| EBITDA margin | 12.9% | 13.2% | 13.8% | |||
| Total assets | 29,355 | 576,381 | 588,541 | -2.1% | 545,623 | 7.9% |
| Total liabilities | 12,266 | 240,839 | 251,629 | -4.3% | 259,453 | -3.0% |
| Total equity | 17,089 | 335,542 | 336,912 | -0.4% | 286,170 | 17.7% |
| Capital expenditures | 1,236 | 24,266 | 23,486 | 3.3% | 22,155 | 6.0% |
| Total cash and cash equivalents 6 | 3,160 | 62,047 | 96,944 | -36.0% | 43,637 | 122.2% |
| Short-term debt | 696 | 13,674 | 13,590 | 0.6% | 7,281 | 86.7% |
| Long-term debt | 5,856 | 114,990 | 117,758 | -2.4% | 131,967 | -10.8% |
| Headcount 7 | 297,073 | 295,027 | 0.7% | 266,144 | 10.9% |
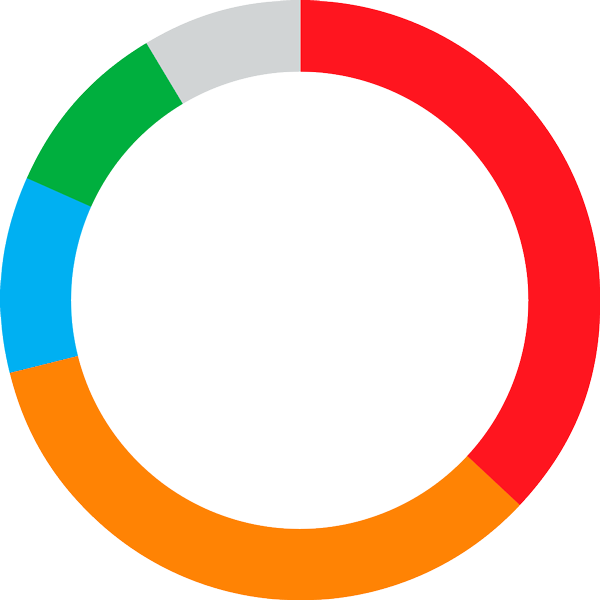
Total Revenues
by Business Unit
millions of Mexican pesos
| Coca-Cola FEMSA FEMSA Comercio: |
37% | |
| Proximity Division | 34% | |
| Health Division | 10% | |
| Fuel Division | 10% | |
| Others* | 9% |
Total Assets
by Business Unit
millions of Mexican pesos
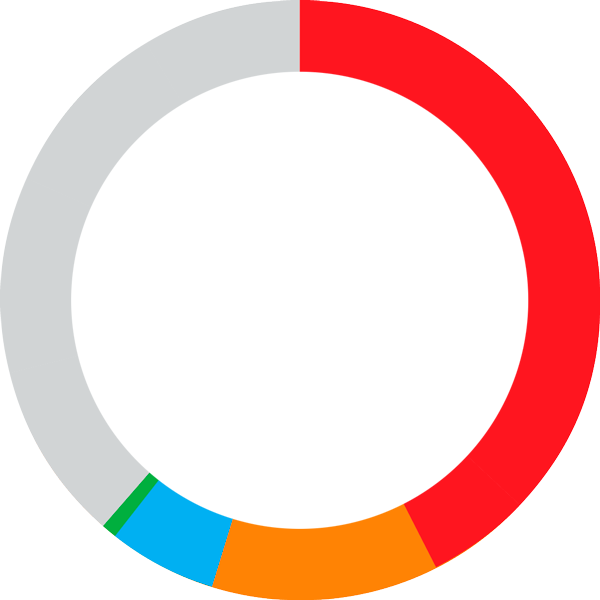
| Coca-Cola FEMSA FEMSA Comercio: |
43% | |
| Proximity Division | 12% | |
| Health Division | 6% | |
| Fuel Division | 1% | |
| Others* | 38% |
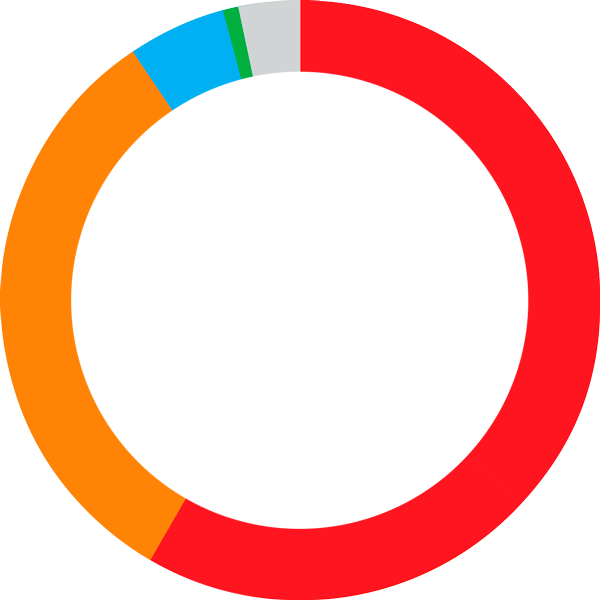
| Coca-Cola FEMSA FEMSA Comercio: |
59% | |
| Proximity Division | 34% | |
| Health Division | 5% | |
| Fuel Division | 1% | |
| Others* | 1% |
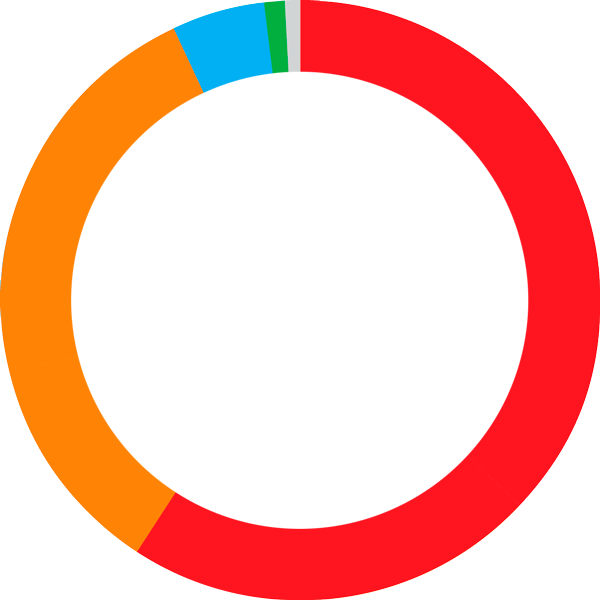
Income from Operations1
by Business Unit
millions of Mexican pesos
| Coca-Cola FEMSA FEMSA Comercio: |
59% | |
| Proximity Division | 32% | |
| Health Division | 5% | |
| Fuel Division | 1% | |
| Others* | 3% |
EBITDA2
by Business Unit
millions of Mexican pesos
SOCIAL and ENVIROMENTAL VALUE
FEMSA creates value for our stakeholders and wider society by generating the economic, social and environmental conditions necessary to operate today and grow sustainably over time. Our sustainability strategy—guided by a commitment to our people, planet and communities—is integral to our business approach.
In 2018, we continued to manage the social and environmental impacts of our products, services and activities across our business units, and we made progress on multiple company-wide sustainability initiatives.
Committing to Clean Energy
85%
of the total electric energy demand of our operations in Mexico will come from renewable energy by 2020.
FEMSA’s goal is to source 85 percent of the total electric energy demand of our operations in Mexico with renewable energy by 2020. By the end of 2018, 37% of our requirements were supplied with clean energy, compared to 26.4% in 2017.
Our progress in 2018 was greatly supported by the launch of the Amistad Wind Farm in November in the state of Coahuila; this dedicated wind farm has a capacity of 197.5 MW and can produce more than 750,000 Mwh of electricity per year – enough to supply an average of 427,350 households in Mexico with electricity.
Looking ahead, we are on track to continue to make solid progress toward achieving our company goal by 2020. In December 2018, the construction of the Energía Eólica del Sur (EES) wind farm was finalized and will start supplying clean energy to FEMSA in early 2019. Located in the state of Oaxaca, the EES wind farm will add 396 MW of capacity with the installation of 132 wind turbines of 3MW each, distributed across two sites.
82% local sourcing
Supporting Local Suppliers
As part of our commitment to responsible sourcing, we consistently seek opportunities for enhancing value creation across our supply chain. This includes supporting local suppliers whenever possible, which in turn supports local economies and reduces the costs and greenhouse gas emissions associated with transporting products over long distances. In 2018, we maintained our spend with local suppliers by over 80 percent.
closer to our goal
At the end of 2018, we sourced 37 percent of clean energy in Mexico, up 10 percent in 2017.
Organizational Climate
The Organizational Climate Diagnostic, our internal employee engagement tool, assesses the level of Satisfaction, Commitment and Quality of Life for all FEMSA employees. The survey is applied to all Business Units every two years, and in 2018, more than 89,000 employees representing 82% participated. The results of the survey confirmed that FEMSA continues to improve, strengthen and promote a harmonious and efficient Organizational Climate for our employees.
In addition to the highlights below, sustainability progress is featured throughout this integrated report, and in our Global Reporting Initiative (GRI) Content Index.
(Gigajoules / Total Revenues in Ps. million)
(Tons of equivalent CO2 / Total Revenues in Ps. million)
(liters of water used per liter of beverage produced)
US$ 13.9 billion
US$ 12.8 billion
US$ 12.5 billion