| Millions of pesos | 2014 1 | 2014 | 2013 | % Change | 2012 | % Change | 2011 2 |
|---|---|---|---|---|---|---|---|
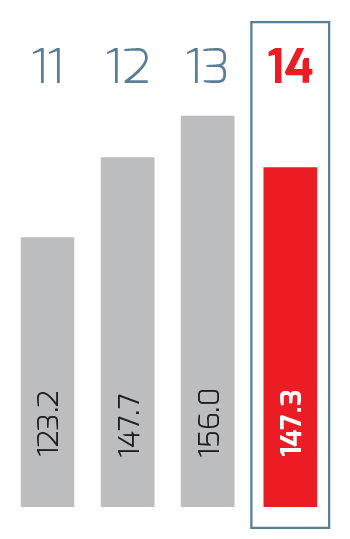
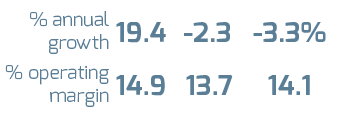
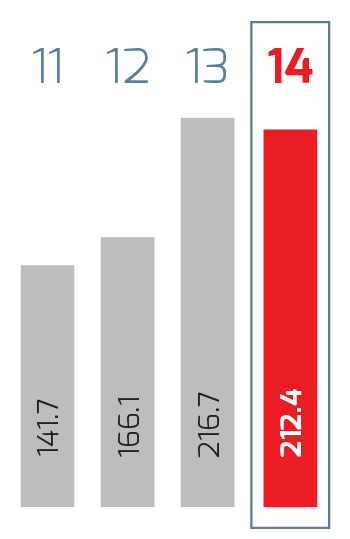
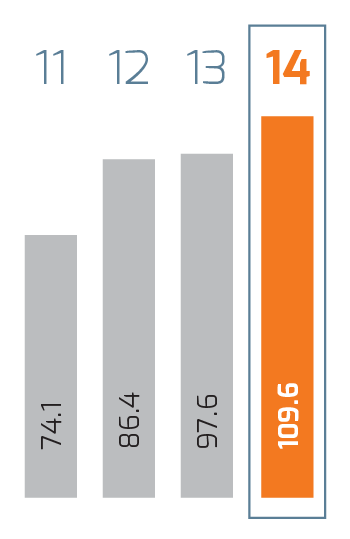
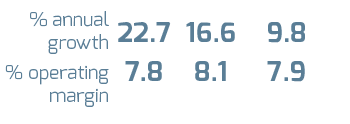
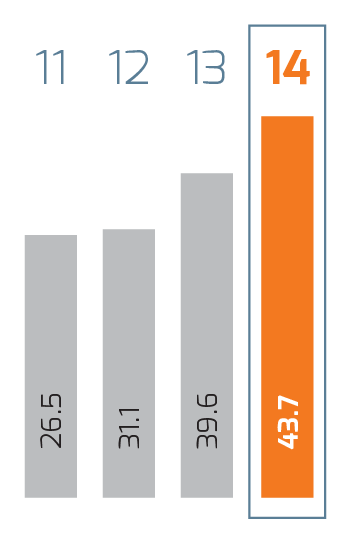
| Total Revenues | 17,861 | 263,449 | 258,097 | 2.1% | 238,309 | 8.3% | 201,540 |
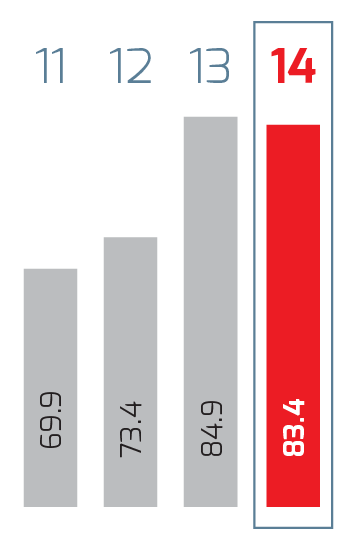
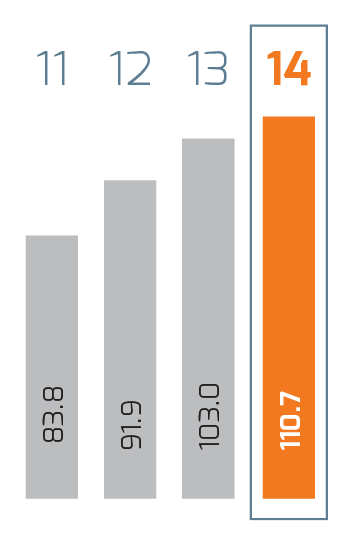
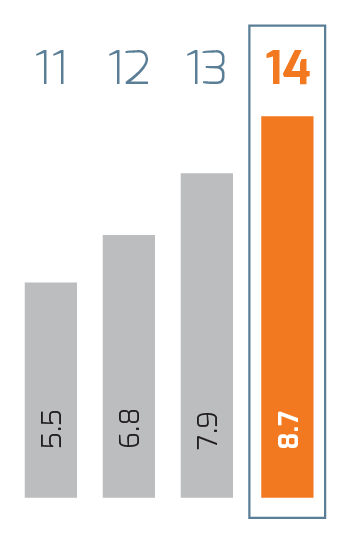
| Income from Operations 3 | 2,033 | 29,983 | 29,857 | 0.4% | 29,227 | 2.2% | 24,484 |
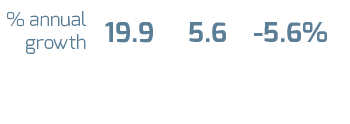
| Consolidated Net Income | 1,534 | 22,630 | 22,155 | 2.1% | 28,051 | -21.0% | 20,901 |
| Controlling Interest 6 | 1,132 | 16,701 | 15,922 | 4.9% | 20,707 | -23.1% | 15,332 |
| Non-Controlling Interest | 402 | 5,929 | 6,233 | -4.9% | 7,344 | -15.1% | 5,569 |
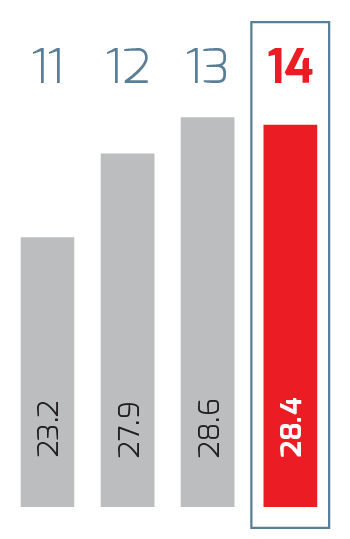
| Total Assets | 25,503 | 376,173 | 359,192 | 4.7% | 295,942 | 21.4% | 263,362 |
| Total Liabilities | 9,902 | 146,051 | 136,642 | 6.9% | 85,781 | 59.3% | 71,191 |
| Total Equity | 15,601 | 230,122 | 222,550 | 3.4% | 210,161 | 5.9% | 192,171 |
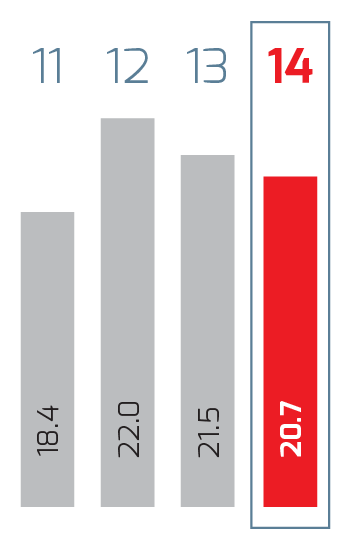
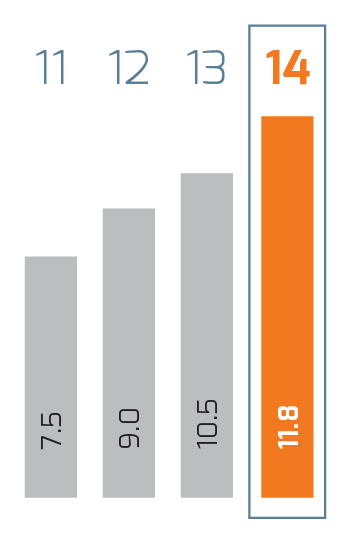
| Capital Expenditures | 1,231 | 18,163 | 17,882 | 1.6% | 15,560 | 14.9% | 12,609 |
| Controlling Interest Book Value per Share 4 | 0.65 | 9.53 | 8.91 | 7.0% | 8.68 | 2.7% | 8.06 |
| Net Controlling Interest Income per Share 4 | 0.06 | 0.93 | 0.89 | 4.9% | 1.16 | -23.1% | 0.86 |
| Headcount 5 | 216,740 | 209,232 | 3.6% | 182,260 | 14.8% | 168,370 |


1 Company’s key performance indicator.
2 EBITDA equals Income from Operations plus Depreciation, Amortization and other non-cash items.